Data visualization Courses
Explore instructor-led and hybrid programs aligned to practical Data visualization use cases across industries.
Available Data visualization Courses
Showing 1-40 of 40 courses

5 days
Accra, Addis Ababa, Bangkok, Cape Town, Dubai, Istanbul, Kigali, Nairobi, Singapore
Accessibility in Data Visualization for Diverse Audiences Training Course
Accessibility in Data Visualization for Diverse Audiences Training Course is meticulously crafted to bridge the gap between advanced data design and inclusivity, ensuring that visual narratives are not only compelling but universally understandable.
Accessibility in Data Visualization for Diverse Audiences Training Course is meticulously crafted to bridge the gap between advanced data design and inclusivity, ensuring that visual narratives are not only compelling but universally understandable.

5 days
Accra, Addis Ababa, Bangkok, Cape Town, Dubai, Istanbul, Kigali, Nairobi, Singapore
Advanced Data Analysis Application Using the R Programming Language Training Course
Advanced Data Analysis Application Using the R Programming Language Training Course is designed for professionals who want to elevate their data analysis skills and dive deeper into the capabilities of R programming
Advanced Data Analysis Application Using the R Programming Language Training Course is designed for professionals who want to elevate their data analysis skills and dive deeper into the capabilities of R programming

10 days
Accra, Addis Ababa, Bangkok, Cape Town, Dubai, Istanbul, Kigali, Nairobi, Singapore
Advanced Flow Cytometry Data Analysis Training Course
Advanced Flow Cytometry Data Analysis Training Course moves beyond the fundamentals, focusing on mastery of cutting-edge, computational flow cytometry workflows
Advanced Flow Cytometry Data Analysis Training Course moves beyond the fundamentals, focusing on mastery of cutting-edge, computational flow cytometry workflows

Research and Data Analysis
5 days
Accra, Addis Ababa, Bangkok, Cape Town, Dubai, Istanbul, Kigali, Nairobi, Singapore
Advanced ggplot2 in R Training Course
Advanced ggplot2 in R training course is meticulously designed for data analysts, statisticians, and data scientists seeking to elevate their data visualization skills to a professional level.
Advanced ggplot2 in R training course is meticulously designed for data analysts, statisticians, and data scientists seeking to elevate their data visualization skills to a professional level.

Monitoring and Evaluation
5 days
Accra, Addis Ababa, Bangkok, Cape Town, Dubai, Istanbul, Kigali, Nairobi, Singapore
Analyzing Big Datasets for M&E Training Course
Analyzing Big Datasets for M&E Training Course provides an advanced, hands-on approach to handling large-scale data, transforming raw datasets into actionable insights, and driving evidence-based decision-making.
Analyzing Big Datasets for M&E Training Course provides an advanced, hands-on approach to handling large-scale data, transforming raw datasets into actionable insights, and driving evidence-based decision-making.

Banking Institute
5 days
Accra, Addis Ababa, Bangkok, Cape Town, Dubai, Istanbul, Kigali, Nairobi, Singapore
Banking Analytics with Power BI Training Course
Banking Analytics with Power BI Training Course is designed to equip banking professionals, analysts, finance experts, and data-driven decision makers with advanced skills in Business Intelligence (BI), Data Analytics, Financial Reporting, Risk Analytics, Customer Insights, and Dashboard Automation.
Banking Analytics with Power BI Training Course is designed to equip banking professionals, analysts, finance experts, and data-driven decision makers with advanced skills in Business Intelligence (BI), Data Analytics, Financial Reporting, Risk Analytics, Customer Insights, and Dashboard Automation.

Banking Institute
5 days
Accra, Addis Ababa, Bangkok, Cape Town, Dubai, Istanbul, Kigali, Nairobi, Singapore
Banking Business Intelligence Training Course
Banking Business Intelligence (BI) Training Course is program designed to equip banking professionals, business analysts, data analysts, risk managers, and decision-makers with the knowledge and practical skills required to transform banking data into strategic business insights.
Banking Business Intelligence (BI) Training Course is program designed to equip banking professionals, business analysts, data analysts, risk managers, and decision-makers with the knowledge and practical skills required to transform banking data into strategic business insights.

5 days
Accra, Addis Ababa, Bangkok, Cape Town, Dubai, Istanbul, Kigali, Nairobi, Singapore
Banking Dashboard Development Training Course
Banking Dashboard Development Training Course is designed to equip professionals with the practical skills required to build interactive banking dashboards, real-time financial reporting systems, and data-driven business intelligence solutions.
Banking Dashboard Development Training Course is designed to equip professionals with the practical skills required to build interactive banking dashboards, real-time financial reporting systems, and data-driven business intelligence solutions.

5 days
Accra, Addis Ababa, Bangkok, Cape Town, Dubai, Istanbul, Kigali, Nairobi, Singapore
Banking Data Analytics Training Course
Banking Data Analytics Training Course is designed to equip banking professionals, financial analysts, risk managers, compliance officers, and aspiring data analysts with advanced analytical skills to drive data-driven decision-making in the modern banking ecosystem.
Banking Data Analytics Training Course is designed to equip banking professionals, financial analysts, risk managers, compliance officers, and aspiring data analysts with advanced analytical skills to drive data-driven decision-making in the modern banking ecosystem.

5 days
Accra, Addis Ababa, Bangkok, Cape Town, Dubai, Istanbul, Kigali, Nairobi, Singapore
Banking Data Science Training Course
Banking Data Science Training Course is designed to help banking professionals, analysts, data scientists, and technology teams harness the power of Artificial Intelligence (AI), Machine Learning (ML), Big Data Analytics, Predictive Modeling, and Financial Data Intelligence.
Banking Data Science Training Course is designed to help banking professionals, analysts, data scientists, and technology teams harness the power of Artificial Intelligence (AI), Machine Learning (ML), Big Data Analytics, Predictive Modeling, and Financial Data Intelligence.

5 days
Accra, Addis Ababa, Bangkok, Cape Town, Dubai, Istanbul, Kigali, Nairobi, Singapore
Banking Payment Analytics Training Course
Banking Payment Analytics Training Course provides a comprehensive understanding of payment data analytics, transaction intelligence, predictive modeling, and regulatory compliance, empowering professionals to optimize payment processes and mitigate risks.
Banking Payment Analytics Training Course provides a comprehensive understanding of payment data analytics, transaction intelligence, predictive modeling, and regulatory compliance, empowering professionals to optimize payment processes and mitigate risks.

5 days
Accra, Addis Ababa, Bangkok, Cape Town, Dubai, Istanbul, Kigali, Nairobi, Singapore
Banking Performance Analytics for Banks Training Course
Banking Performance Analytics for Banks Training Course is designed to equip banking professionals with cutting-edge tools and frameworks to measure, monitor, and optimize performance using data analytics, KPI frameworks, and performance benchmarking.
Banking Performance Analytics for Banks Training Course is designed to equip banking professionals with cutting-edge tools and frameworks to measure, monitor, and optimize performance using data analytics, KPI frameworks, and performance benchmarking.

5 days
Accra, Addis Ababa, Bangkok, Cape Town, Dubai, Istanbul, Kigali, Nairobi, Singapore
Banking Risk Dashboards Training Course
Banking Risk Dashboards Training Course equips professionals with cutting-edge skills in risk visualization, KPI tracking, and intelligent reporting frameworks.
Banking Risk Dashboards Training Course equips professionals with cutting-edge skills in risk visualization, KPI tracking, and intelligent reporting frameworks.

10 days
Accra, Addis Ababa, Bangkok, Cape Town, Dubai, Istanbul, Kigali, Nairobi, Singapore
BIM Data Visualization Dashboards Training Course
BIM Data Visualization Dashboards Training Course equips professionals with cutting-edge skills in data integration, visualization design, dashboard development, and predictive analytics tailored for BIM workflows
BIM Data Visualization Dashboards Training Course equips professionals with cutting-edge skills in data integration, visualization design, dashboard development, and predictive analytics tailored for BIM workflows

Public Relations and Communication
5 days
Accra, Addis Ababa, Bangkok, Cape Town, Dubai, Istanbul, Kigali, Nairobi, Singapore
Communication Performance Analytics Training Course
Communication Performance Analytics Training Course equips professionals with advanced skills in communication metrics analysis, KPI tracking, audience behavior insights, and performance optimization strategies using modern analytics frameworks and tools.
Communication Performance Analytics Training Course equips professionals with advanced skills in communication metrics analysis, KPI tracking, audience behavior insights, and performance optimization strategies using modern analytics frameworks and tools.

Public Relations and Communication
5 days
Accra, Addis Ababa, Bangkok, Cape Town, Dubai, Istanbul, Kigali, Nairobi, Singapore
Corporate Communication Analytics Training Course
Corporate Communication Analytics Training Course is designed to equip professionals with advanced skills in communication data analytics, media intelligence, digital reputation tracking, and predictive communication modeling
Corporate Communication Analytics Training Course is designed to equip professionals with advanced skills in communication data analytics, media intelligence, digital reputation tracking, and predictive communication modeling

Customer Service and Customer Experience
5 days
Accra, Addis Ababa, Bangkok, Cape Town, Dubai, Istanbul, Kigali, Nairobi, Singapore
Creating Service Dashboards in Power BI Training Course
Creating Service Dashboards in Power BI Training Course equips professionals with advanced skills to transform raw service data into actionable intelligence.
Creating Service Dashboards in Power BI Training Course equips professionals with advanced skills to transform raw service data into actionable intelligence.
10 days
Accra, Addis Ababa, Bangkok, Cape Town, Dubai, Istanbul, Kigali, Nairobi, Singapore
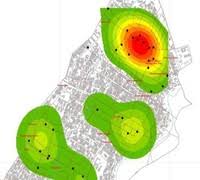
Crime Mapping and Geospatial Analysis (GIS for Criminology) Training Course
Training Course on Crime Mapping & Geospatial Analysis (GIS for Criminology) is a cutting-edge program designed to empower professionals in the criminal justice and public safety sectors with advanced skills in spatial data analysis.
Training Course on Crime Mapping & Geospatial Analysis (GIS for Criminology) is a cutting-edge program designed to empower professionals in the criminal justice and public safety sectors with advanced skills in spatial data analysis.
10 days
Accra, Addis Ababa, Bangkok, Cape Town, Dubai, Istanbul, Kigali, Nairobi, Singapore
Crime Mapping and GIS for Criminology Training Course
Crime Mapping and GIS for Criminology Training Course equips professionals and students with data-driven decision-making skills, utilizing location-based crime analytics, predictive policing, and spatial pattern detection.
Crime Mapping and GIS for Criminology Training Course equips professionals and students with data-driven decision-making skills, utilizing location-based crime analytics, predictive policing, and spatial pattern detection.

Customer Service and Customer Experience
5 days
Accra, Addis Ababa, Bangkok, Cape Town, Dubai, Istanbul, Kigali, Nairobi, Singapore
CX Metrics for Executive Dashboards Training Course
CX Metrics for Executive Dashboards Training Course empowers executives and CX professionals with advanced skills to design, implement, and interpret dashboards that drive strategic decision-making and operational excellence.
CX Metrics for Executive Dashboards Training Course empowers executives and CX professionals with advanced skills to design, implement, and interpret dashboards that drive strategic decision-making and operational excellence.

Research and Data Analysis
5 days
Accra, Addis Ababa, Bangkok, Cape Town, Dubai, Istanbul, Kigali, Nairobi, Singapore
Dashboard Design for Stakeholders Training Course
Dashboard Design for Stakeholders Training Course equips professionals with the skills to create impactful, actionable, and user-friendly dashboards tailored for diverse business needs.
Dashboard Design for Stakeholders Training Course equips professionals with the skills to create impactful, actionable, and user-friendly dashboards tailored for diverse business needs.

5 days
Accra, Addis Ababa, Bangkok, Cape Town, Dubai, Istanbul, Kigali, Nairobi, Singapore
Data Storytelling for Migration Advocacy Training Course
Data Storytelling for Migration Advocacy Training Course equips participants with the latest techniques in visual storytelling, advanced analytics, migration data interpretation, and audience-centered advocacy strategies.
Data Storytelling for Migration Advocacy Training Course equips participants with the latest techniques in visual storytelling, advanced analytics, migration data interpretation, and audience-centered advocacy strategies.

5 days
Accra, Addis Ababa, Bangkok, Cape Town, Dubai, Istanbul, Kigali, Nairobi, Singapore
Data Visualization for Banks Training Course
Data Visualization for Banks Training Course equips banking professionals with cutting-edge skills in data storytelling, predictive analytics visualization, KPI dashboards, and interactive reporting, enabling them to uncover hidden patterns and trends that drive strategic growth.
Data Visualization for Banks Training Course equips banking professionals with cutting-edge skills in data storytelling, predictive analytics visualization, KPI dashboards, and interactive reporting, enabling them to uncover hidden patterns and trends that drive strategic growth.

5 days
Accra, Addis Ababa, Bangkok, Cape Town, Dubai, Istanbul, Kigali, Nairobi, Singapore
Data Visualization for Labour Organizations Training Course
Data Visualization for Labour Organizations Training Course is designed to strengthen institutional capacity in labour organizations by leveraging modern tools such as Power BI, Tableau, Excel analytics, and open-source visualization platforms.
Data Visualization for Labour Organizations Training Course is designed to strengthen institutional capacity in labour organizations by leveraging modern tools such as Power BI, Tableau, Excel analytics, and open-source visualization platforms.

5 days
Accra, Addis Ababa, Bangkok, Cape Town, Dubai, Istanbul, Kigali, Nairobi, Singapore
Data Visualization for Quality Reporting (Power BI/Tableau) Training Course
Data Visualization for Quality Reporting (Power BI/Tableau) Training Course on mastering data visualization techniques, enabling participants to communicate complex information with clarity, precision, and impact.
Data Visualization for Quality Reporting (Power BI/Tableau) Training Course on mastering data visualization techniques, enabling participants to communicate complex information with clarity, precision, and impact.

Monitoring and Evaluation
5 days
Accra, Addis Ababa, Bangkok, Cape Town, Dubai, Istanbul, Kigali, Nairobi, Singapore
Designing Effective M&E Dashboards Training Course
Designing Effective M&E Dashboards Training Course equips participants with the skills to create dynamic, visually compelling, and decision-oriented dashboards.
Designing Effective M&E Dashboards Training Course equips participants with the skills to create dynamic, visually compelling, and decision-oriented dashboards.

Research and Data Analysis
5 days
Accra, Addis Ababa, Bangkok, Cape Town, Dubai, Istanbul, Kigali, Nairobi, Singapore
Digital Humanities Research Methods Training Course
Digital Humanities Research Methods Training Course offers an intensive exploration of digital research methods, data visualization, computational text analysis, and digital archiving, equipping scholars with the tools to tackle complex research questions in innovative ways.
Digital Humanities Research Methods Training Course offers an intensive exploration of digital research methods, data visualization, computational text analysis, and digital archiving, equipping scholars with the tools to tackle complex research questions in innovative ways.

10 days
Accra, Addis Ababa, Bangkok, Cape Town, Dubai, Istanbul, Kigali, Nairobi, Singapore
Disease Mapping & GIS Training Course
Disease Mapping & GIS Training Course equips learners with advanced skills in spatial data analysis, health informatics, geospatial intelligence, and epidemic surveillance systems.
Disease Mapping & GIS Training Course equips learners with advanced skills in spatial data analysis, health informatics, geospatial intelligence, and epidemic surveillance systems.

Veterinary and Animal Science
5 days
Accra, Addis Ababa, Bangkok, Cape Town, Dubai, Istanbul, Kigali, Nairobi, Singapore
Epidemiological Modeling Tools Training Course
Epidemiological Modeling Tools Training Course is designed to equip public health professionals, data scientists, and researchers with cutting-edge skills to simulate, predict, and analyze the spread of infectious diseases.
Epidemiological Modeling Tools Training Course is designed to equip public health professionals, data scientists, and researchers with cutting-edge skills to simulate, predict, and analyze the spread of infectious diseases.

Research and Data Analysis
10 days
Accra, Addis Ababa, Bangkok, Cape Town, Dubai, Istanbul, Kigali, Nairobi, Singapore
EViews for Econometrics Training Course
EViews for Econometrics Training Course a comprehensive, hands-on experience, blending theoretical concepts with practical applications to ensure participants can leverage advanced econometric techniques, including time series analysis, panel data modeling, and forecasting, to drive actionable insights.
EViews for Econometrics Training Course a comprehensive, hands-on experience, blending theoretical concepts with practical applications to ensure participants can leverage advanced econometric techniques, including time series analysis, panel data modeling, and forecasting, to drive actionable insights.

10 days
Accra, Addis Ababa, Bangkok, Cape Town, Dubai, Istanbul, Kigali, Nairobi, Singapore
Excel and Power BI for Labour Analytics Training Course
Excel and Power BI for Labour Analytics Training Course is designed to equip professionals with advanced skills in HR analytics, workforce intelligence, KPI tracking, automation, and predictive labour insights using industry-leading tools.
Excel and Power BI for Labour Analytics Training Course is designed to equip professionals with advanced skills in HR analytics, workforce intelligence, KPI tracking, automation, and predictive labour insights using industry-leading tools.

Mineral & Mining Engineering
5 days
Accra, Addis Ababa, Bangkok, Cape Town, Dubai, Istanbul, Kigali, Nairobi, Singapore
Exploration Data Interpretation Training Course
Exploration Data Interpretation Training Course bridges the gap between raw data and actionable intelligence by teaching participants how to interpret complex datasets using modern tools and machine learning techniques.
Exploration Data Interpretation Training Course bridges the gap between raw data and actionable intelligence by teaching participants how to interpret complex datasets using modern tools and machine learning techniques.

5 days
Accra, Addis Ababa, Bangkok, Cape Town, Dubai, Istanbul, Kigali, Nairobi, Singapore
Fundamentals of Data Science Training Course
Fundamentals of Data Science Training Course is designed to provide a comprehensive introduction to data science concepts, tools, and techniques
Fundamentals of Data Science Training Course is designed to provide a comprehensive introduction to data science concepts, tools, and techniques
10 days
Accra, Addis Ababa, Bangkok, Cape Town, Dubai, Istanbul, Kigali, Nairobi, Singapore
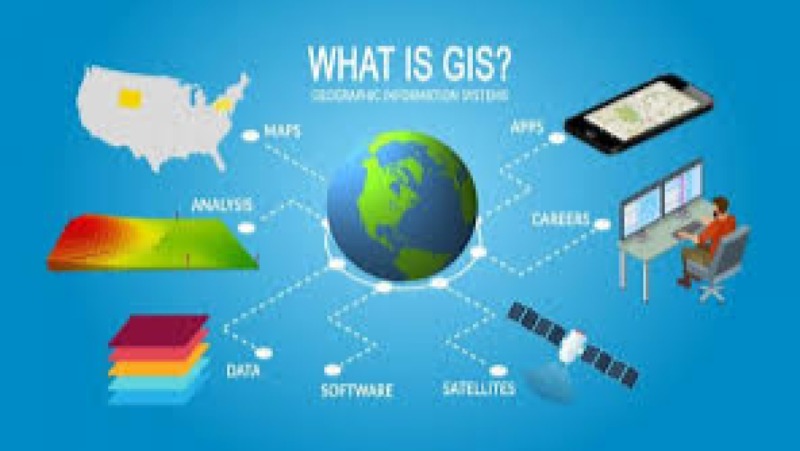
Geospatial Analytics Training Course
Geospatial Analytics Training Course is engineered to bridge the gap between raw geographic data and actionable intelligence by leveraging cutting-edge tools like GIS Remote Sensing, and Spatial Data Science.
Geospatial Analytics Training Course is engineered to bridge the gap between raw geographic data and actionable intelligence by leveraging cutting-edge tools like GIS Remote Sensing, and Spatial Data Science.
5 days
Accra, Addis Ababa, Bangkok, Cape Town, Dubai, Istanbul, Kigali, Nairobi, Singapore
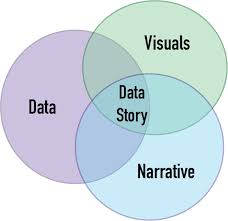
Geospatial Storytelling with Data Narratives Training Course
Geospatial Storytelling with Data Narratives Training Course empowers professionals to unlock the immense power of location intelligence.
Geospatial Storytelling with Data Narratives Training Course empowers professionals to unlock the immense power of location intelligence.
Veterinary and Animal Science
10 days
Accra, Addis Ababa, Bangkok, Cape Town, Dubai, Istanbul, Kigali, Nairobi, Singapore
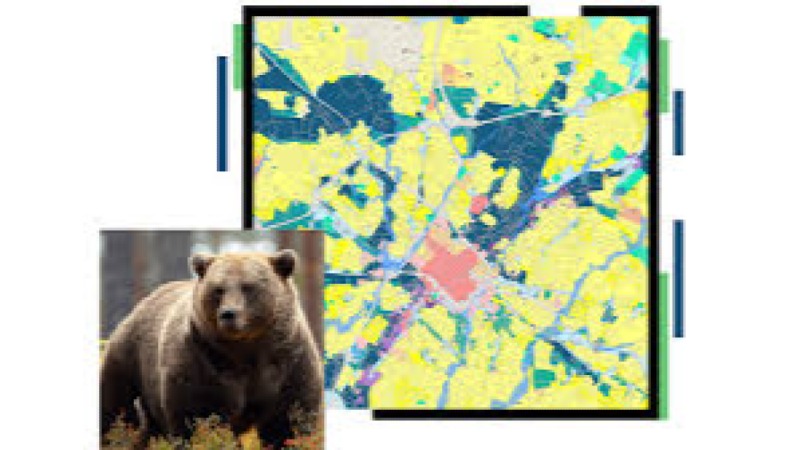
GIS for Animal Studies Training Course
GIS for Animal Studies Training Course is designed to empower wildlife researchers, ecologists, and conservationists with cutting-edge spatial analysis and geospatial mapping skills.
GIS for Animal Studies Training Course is designed to empower wildlife researchers, ecologists, and conservationists with cutting-edge spatial analysis and geospatial mapping skills.
10 days
Accra, Addis Ababa, Bangkok, Cape Town, Dubai, Istanbul, Kigali, Nairobi, Singapore
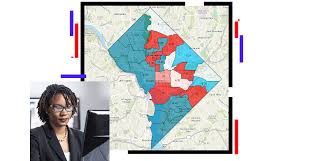
GIS for Census and Demographics Analysis Training Course
GIS for Census and Demographics Analysis Training Course is meticulously designed to empower professionals with the cutting-edge geospatial technologies and analytical methodologies required to effectively capture, manage, analyze, and visualize population data
GIS for Census and Demographics Analysis Training Course is meticulously designed to empower professionals with the cutting-edge geospatial technologies and analytical methodologies required to effectively capture, manage, analyze, and visualize population data
5 days
Accra, Addis Ababa, Bangkok, Cape Town, Dubai, Istanbul, Kigali, Nairobi, Singapore
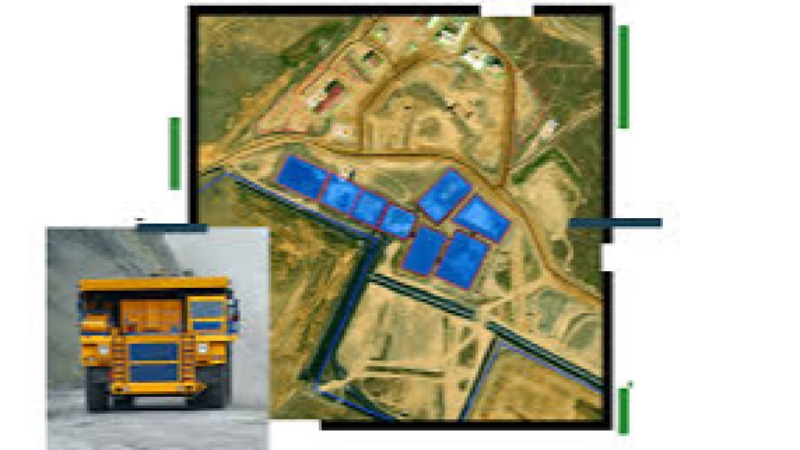
GIS for Mining Applications Training Course
GIS for Mining Applications Training Course is designed to equip professionals with cutting-edge skills in geospatial technologies tailored specifically for the mining sector.
GIS for Mining Applications Training Course is designed to equip professionals with cutting-edge skills in geospatial technologies tailored specifically for the mining sector.

Monitoring and Evaluation
10 days
Accra, Addis Ababa, Bangkok, Cape Town, Dubai, Istanbul, Kigali, Nairobi, Singapore
GIS Mapping for M&E Training Course
GIS Mapping for M&E Training Course equips participants with advanced GIS mapping skills to enhance data-driven decision-making, spatial analysis, and performance monitoring.
GIS Mapping for M&E Training Course equips participants with advanced GIS mapping skills to enhance data-driven decision-making, spatial analysis, and performance monitoring.

Monitoring and Evaluation
5 days
Accra, Addis Ababa, Bangkok, Cape Town, Dubai, Istanbul, Kigali, Nairobi, Singapore
Google Data Studio for M&E Reporting Training Course
Google Data Studio for M&E Reporting Training Course equips participants with the skills to visualize, analyze, and communicate complex program data efficiently.
Google Data Studio for M&E Reporting Training Course equips participants with the skills to visualize, analyze, and communicate complex program data efficiently.